
Creating a Financial Dashboard That Drives Better Decisions

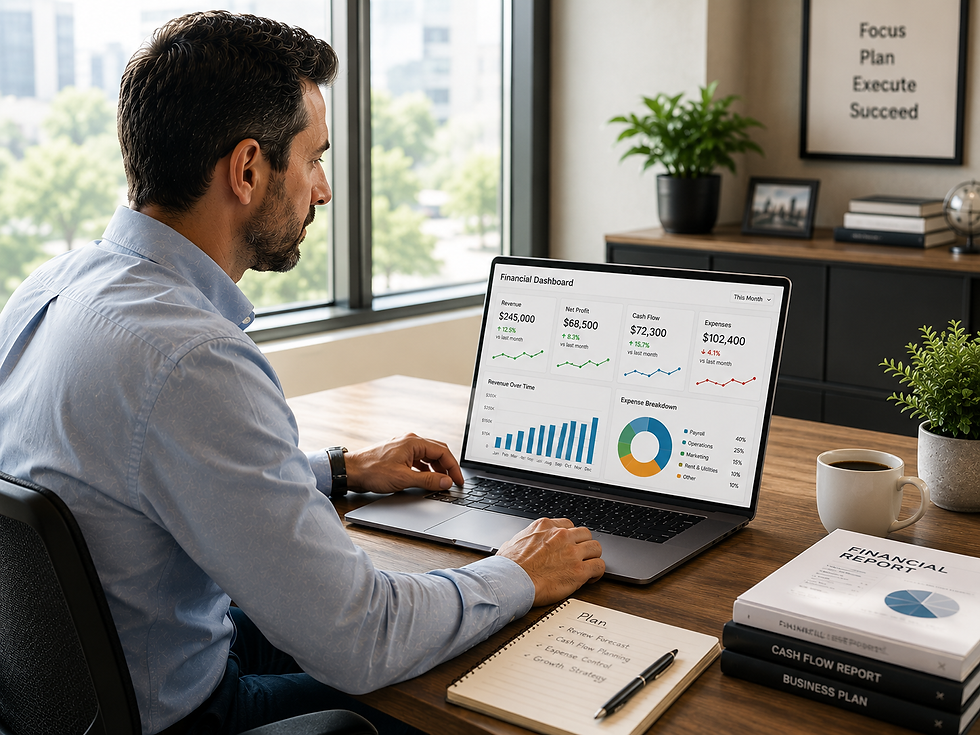
You Cannot Improve What You Do Not Measure. Successful business owners do not make decisions based on assumptions. They make decisions based on data. A financial dashboard provides a clear snapshot of your business performance and helps you identify opportunities, risks, and trends before they become major issues. Instead of searching through multiple reports, a dashboard brings your most important financial information into one place. The result is faster, smarter decision-making.
What Is a Financial Dashboard?
A financial dashboard is a visual summary of your key financial metrics.
It allows you to quickly monitor the health of your business and track progress toward your goals.
Think of it as the control center for your business finances.
A well-designed dashboard answers important questions such as:
Are we profitable?
Is cash flow healthy?
Are expenses under control?
Are we meeting our financial goals?
Why Every Business Needs a Financial Dashboard
Without a dashboard, business owners often:
React to problems too late
Spend time searching for information
Make decisions without complete data
A dashboard provides:
Financial visibility
Faster decision-making
Improved accountability
Better strategic planning
Clarity creates confidence.
Creating a Financial Dashboard That Drives Better Decisions
1. Track Revenue Performance
Revenue is one of the first metrics every dashboard should include.
Monitor:
Monthly revenue
Year-to-date revenue
Revenue growth trends
These numbers help you understand whether your business is moving toward its sales goals.
2. Monitor Profitability
Revenue alone does not determine success.
Your dashboard should also track:
Gross profit
Net profit
Profit margins
These metrics reveal how efficiently your business is generating income.
3. Watch Cash Flow Closely
Cash flow is often the most important number on your dashboard.
Include:
Cash on hand
Monthly cash inflows
Monthly cash outflows
Cash flow trends
Healthy cash flow supports stability and growth.
4. Measure Operating Expenses
Expenses can quietly reduce profitability.
Track:
Total monthly expenses
Expense categories
Expense trends
This helps identify areas where costs may be increasing unnecessarily.
5. Track Accounts Receivable
Outstanding invoices impact cash flow.
Your dashboard should show:
Total accounts receivable
Overdue invoices
Average collection time
The faster you collect payments, the healthier your cash position becomes.
6. Include Key Performance Indicators (KPIs)
Every business should identify a few critical metrics that support decision-making.
Examples include:
Customer acquisition cost
Customer retention rate
Revenue per client
Average transaction value
KPIs connect financial performance to business operations.
7. Compare Actual Results to Goals
A dashboard becomes more valuable when performance is measured against targets.
Include:
Budget versus actual revenue
Budget versus actual expenses
Profit goals versus actual results
This helps keep your business aligned with its objectives.
Keep It Simple
One of the biggest dashboard mistakes is including too much information.
Focus on the numbers that matter most.
A good dashboard should:
Be easy to understand
Update regularly
Highlight trends quickly
Support decision-making
The goal is clarity, not complexity.
Review Your Dashboard Monthly
A dashboard is only useful if it is reviewed consistently.
Schedule time each month to evaluate:
Revenue performance
Profitability
Cash flow
Financial goals
Regular reviews allow you to make adjustments before problems grow.
What Successful Business Owners Do Differently
Successful leaders use dashboards to:
Spot financial trends early
Improve profitability
Strengthen cash flow
Hold teams accountable
Make informed decisions
They manage proactively instead of reactively.
The Real Purpose of a Financial Dashboard
A dashboard is more than a collection of numbers.
It is a decision-making tool.
When you can clearly see the financial health of your business, you gain the confidence to make strategic decisions that support long-term growth.
How We Can Help
At Loomis Reddick and Bishop, we help business owners create financial dashboards that provide meaningful insights and support smarter decision-making.
Our Impact Team helps businesses:
Design customized financial dashboards
Identify meaningful KPIs
Improve financial reporting
Strengthen cash flow visibility
Develop forecasting systems
Create strategic financial plans
We help transform financial data into actionable business intelligence.
Contact Us
If you are making business decisions without a clear financial dashboard, you may be missing critical information that impacts growth and profitability. Contact the Loomis Reddick and Bishop Impact Team today. Let us help you build a financial dashboard that provides clarity, supports better decisions, and positions your business for long-term success.

We Transform Your Vision Into Reality, Empowering You to Thrive & Go Further Faster!


Comments